Welcome to CaneApp
The app that lets you track hurricanes in new and exciting ways.
Download CaneApp For Free Today
![]()
![]()
CaneApp Does What No Other Hurricane App Can!
Cane keeps you up-to-date with the latest information on active hurricanes from the NHC. Cane leverages all of the data available from the National Hurricane Center (NHC), International Best Track Archive for Climate Stewardship (IBTrACS) and other sources to give you as much information as possible at your fingertips.
Cane gives you:
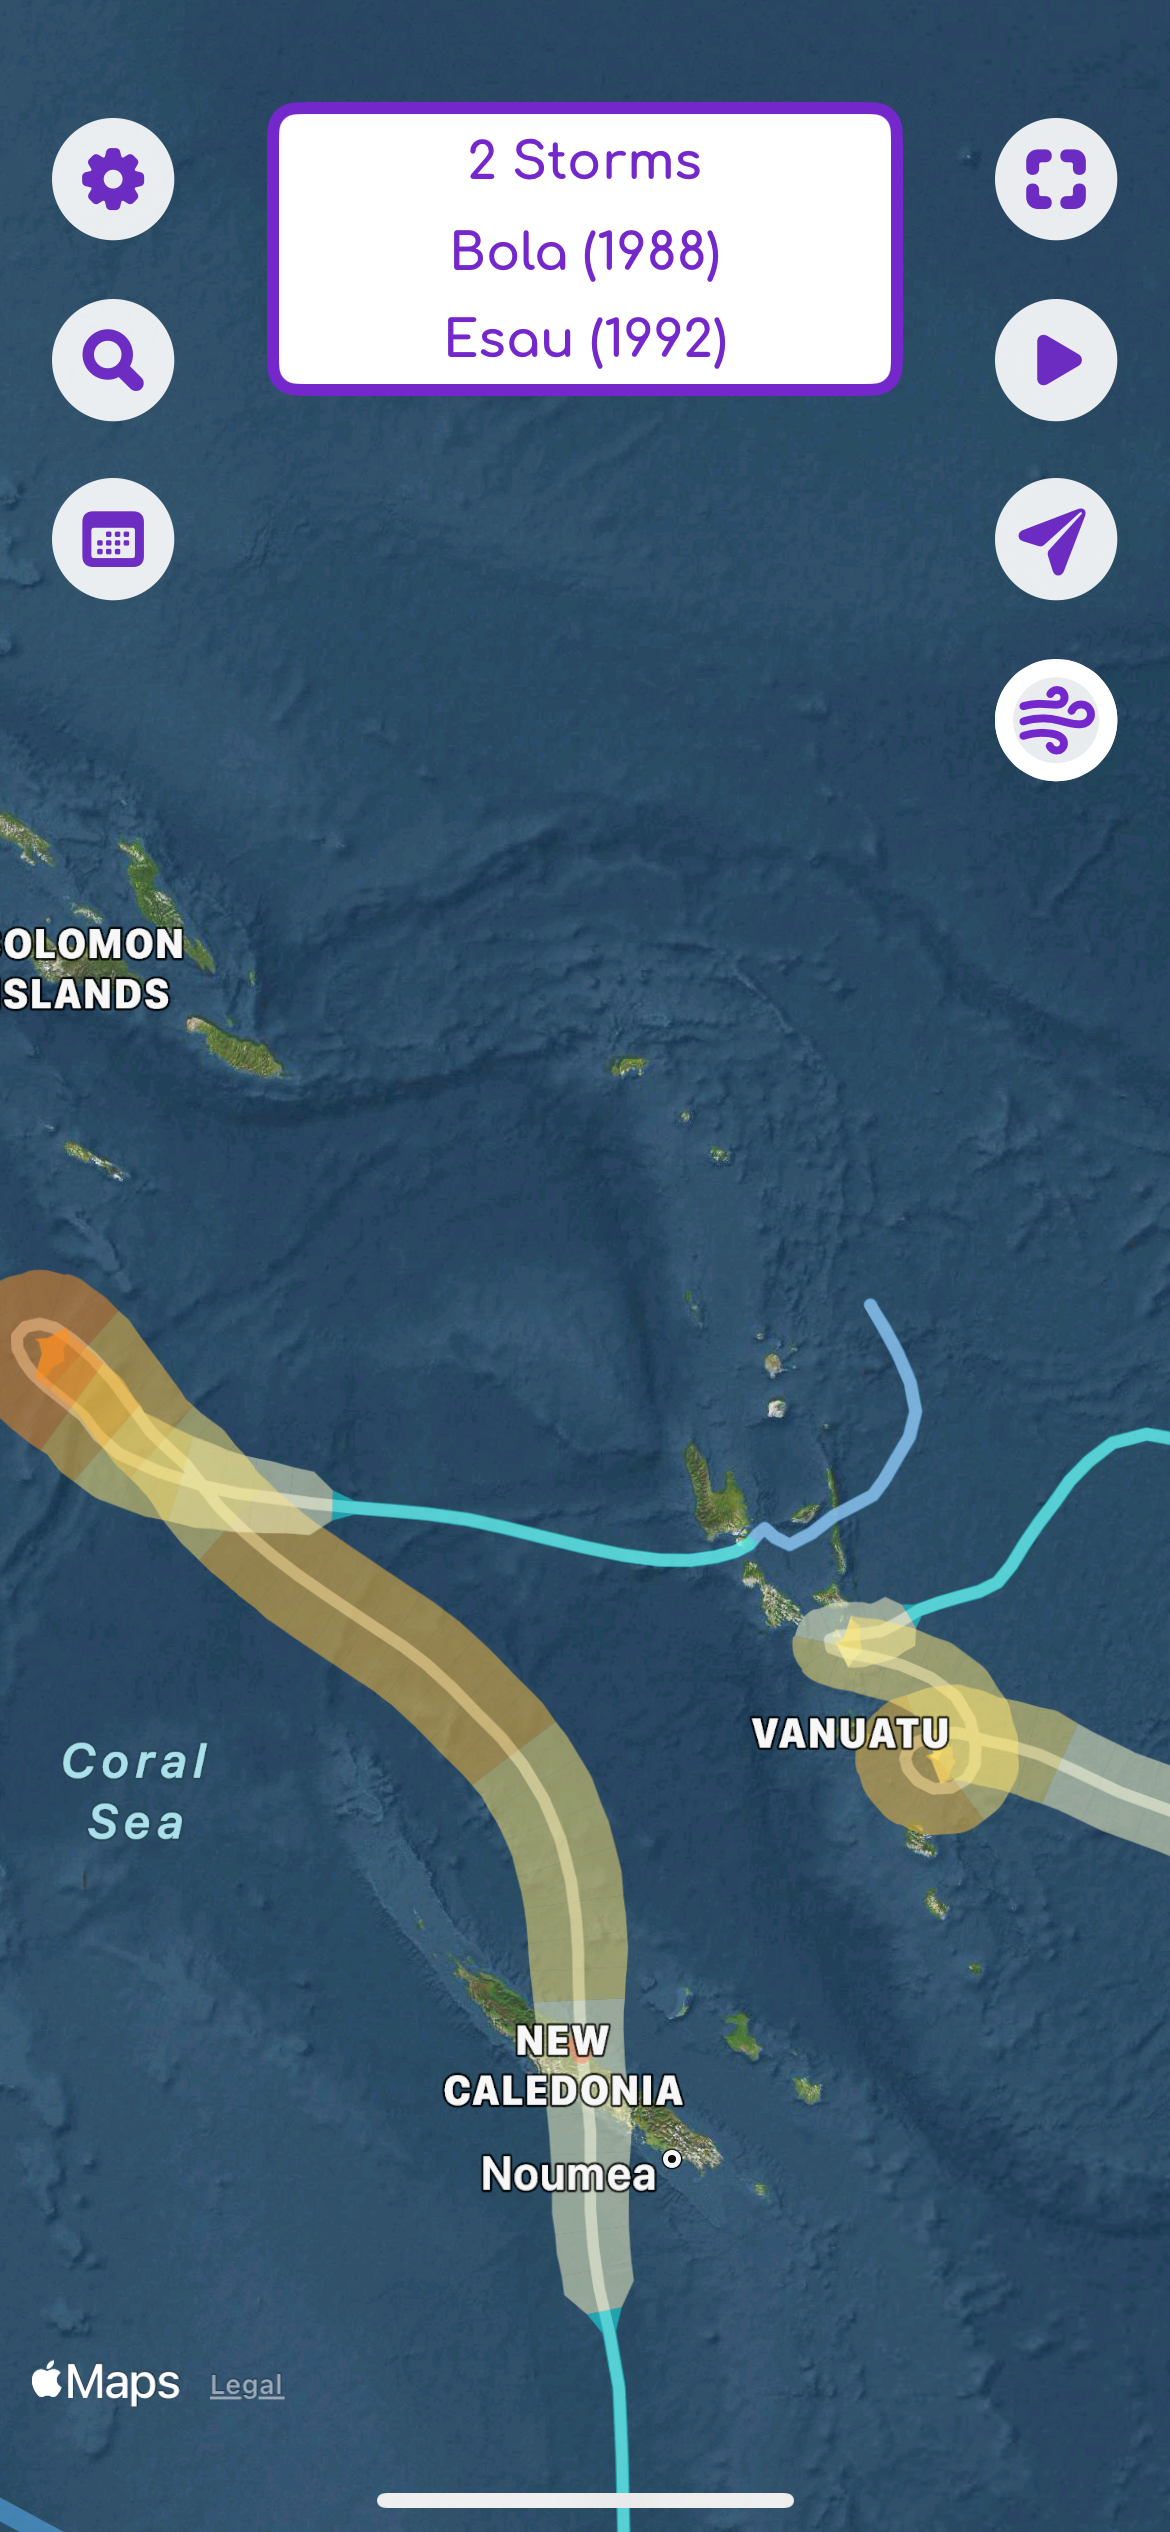
- Current global storm activity
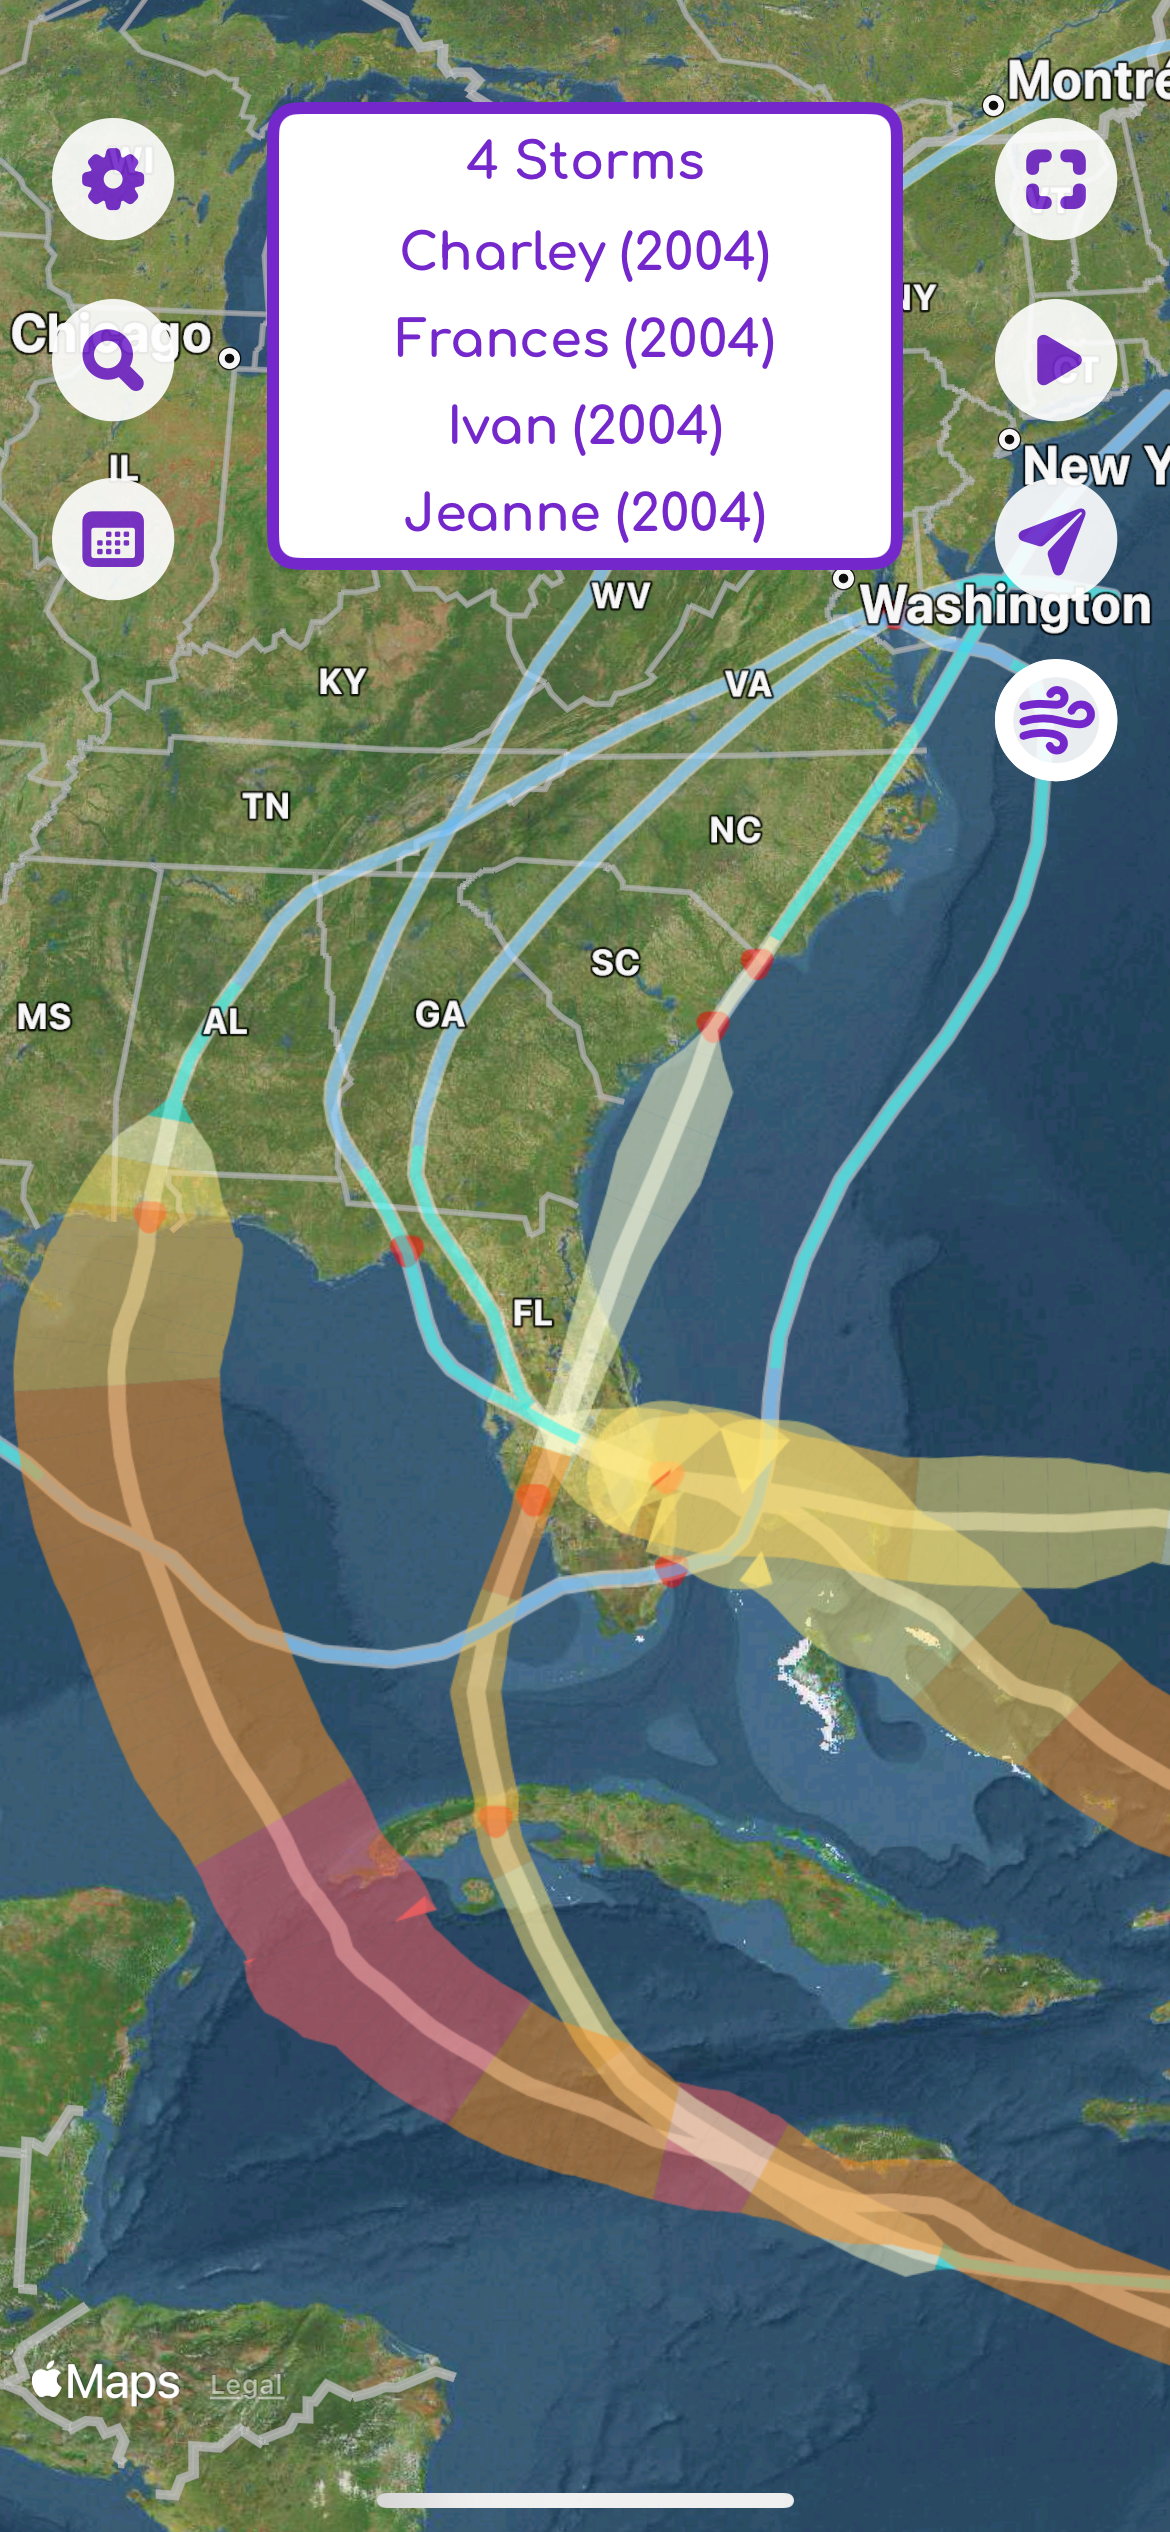
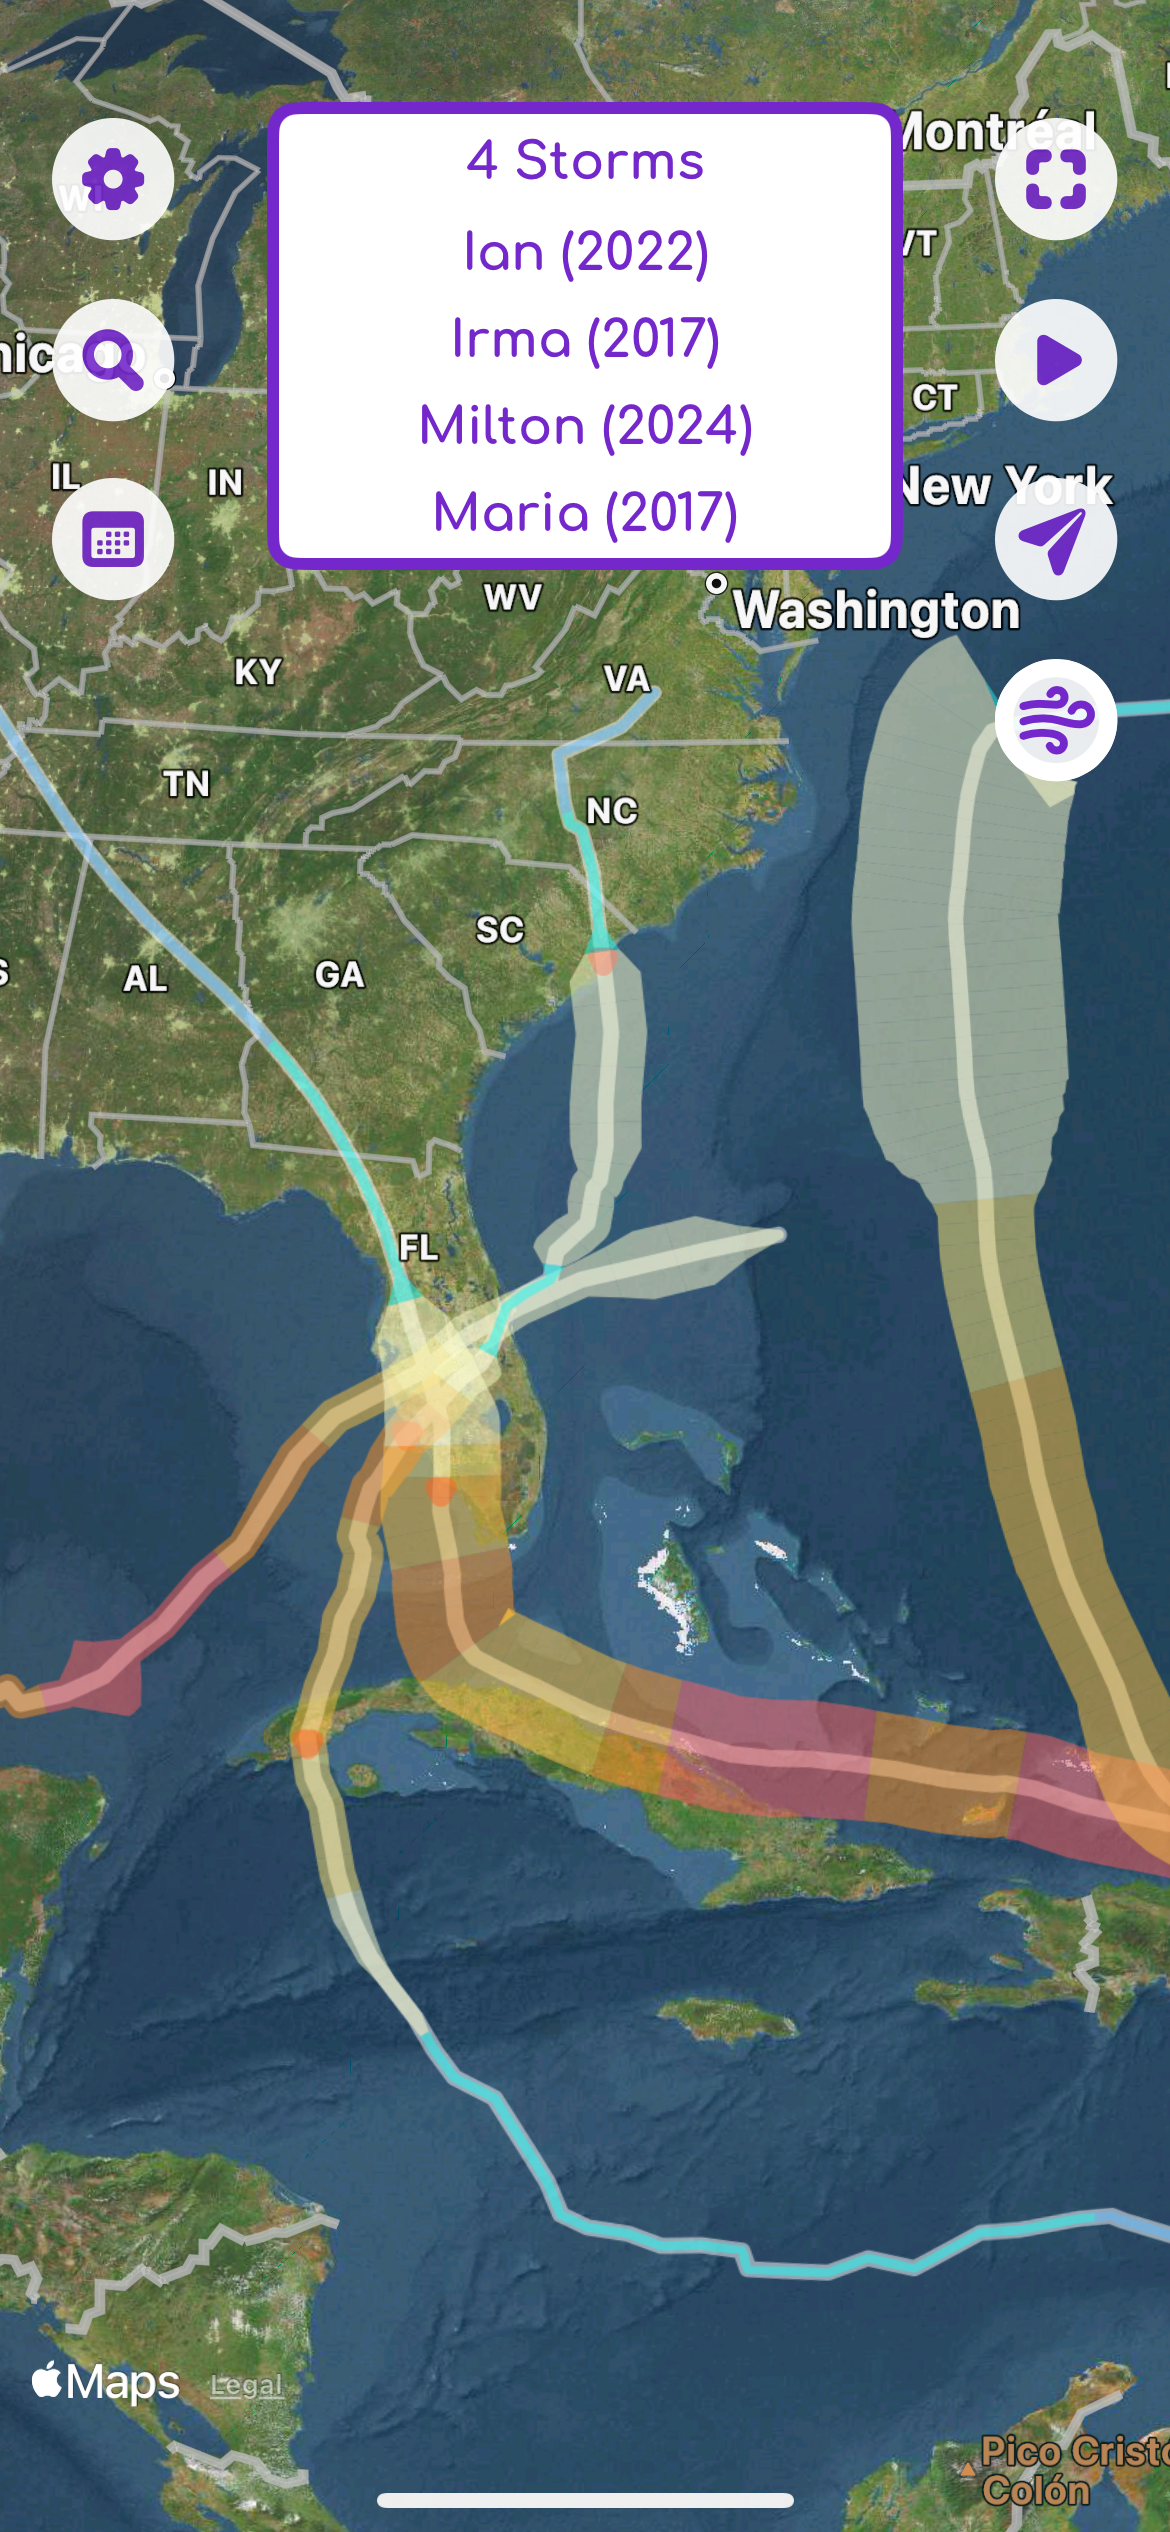
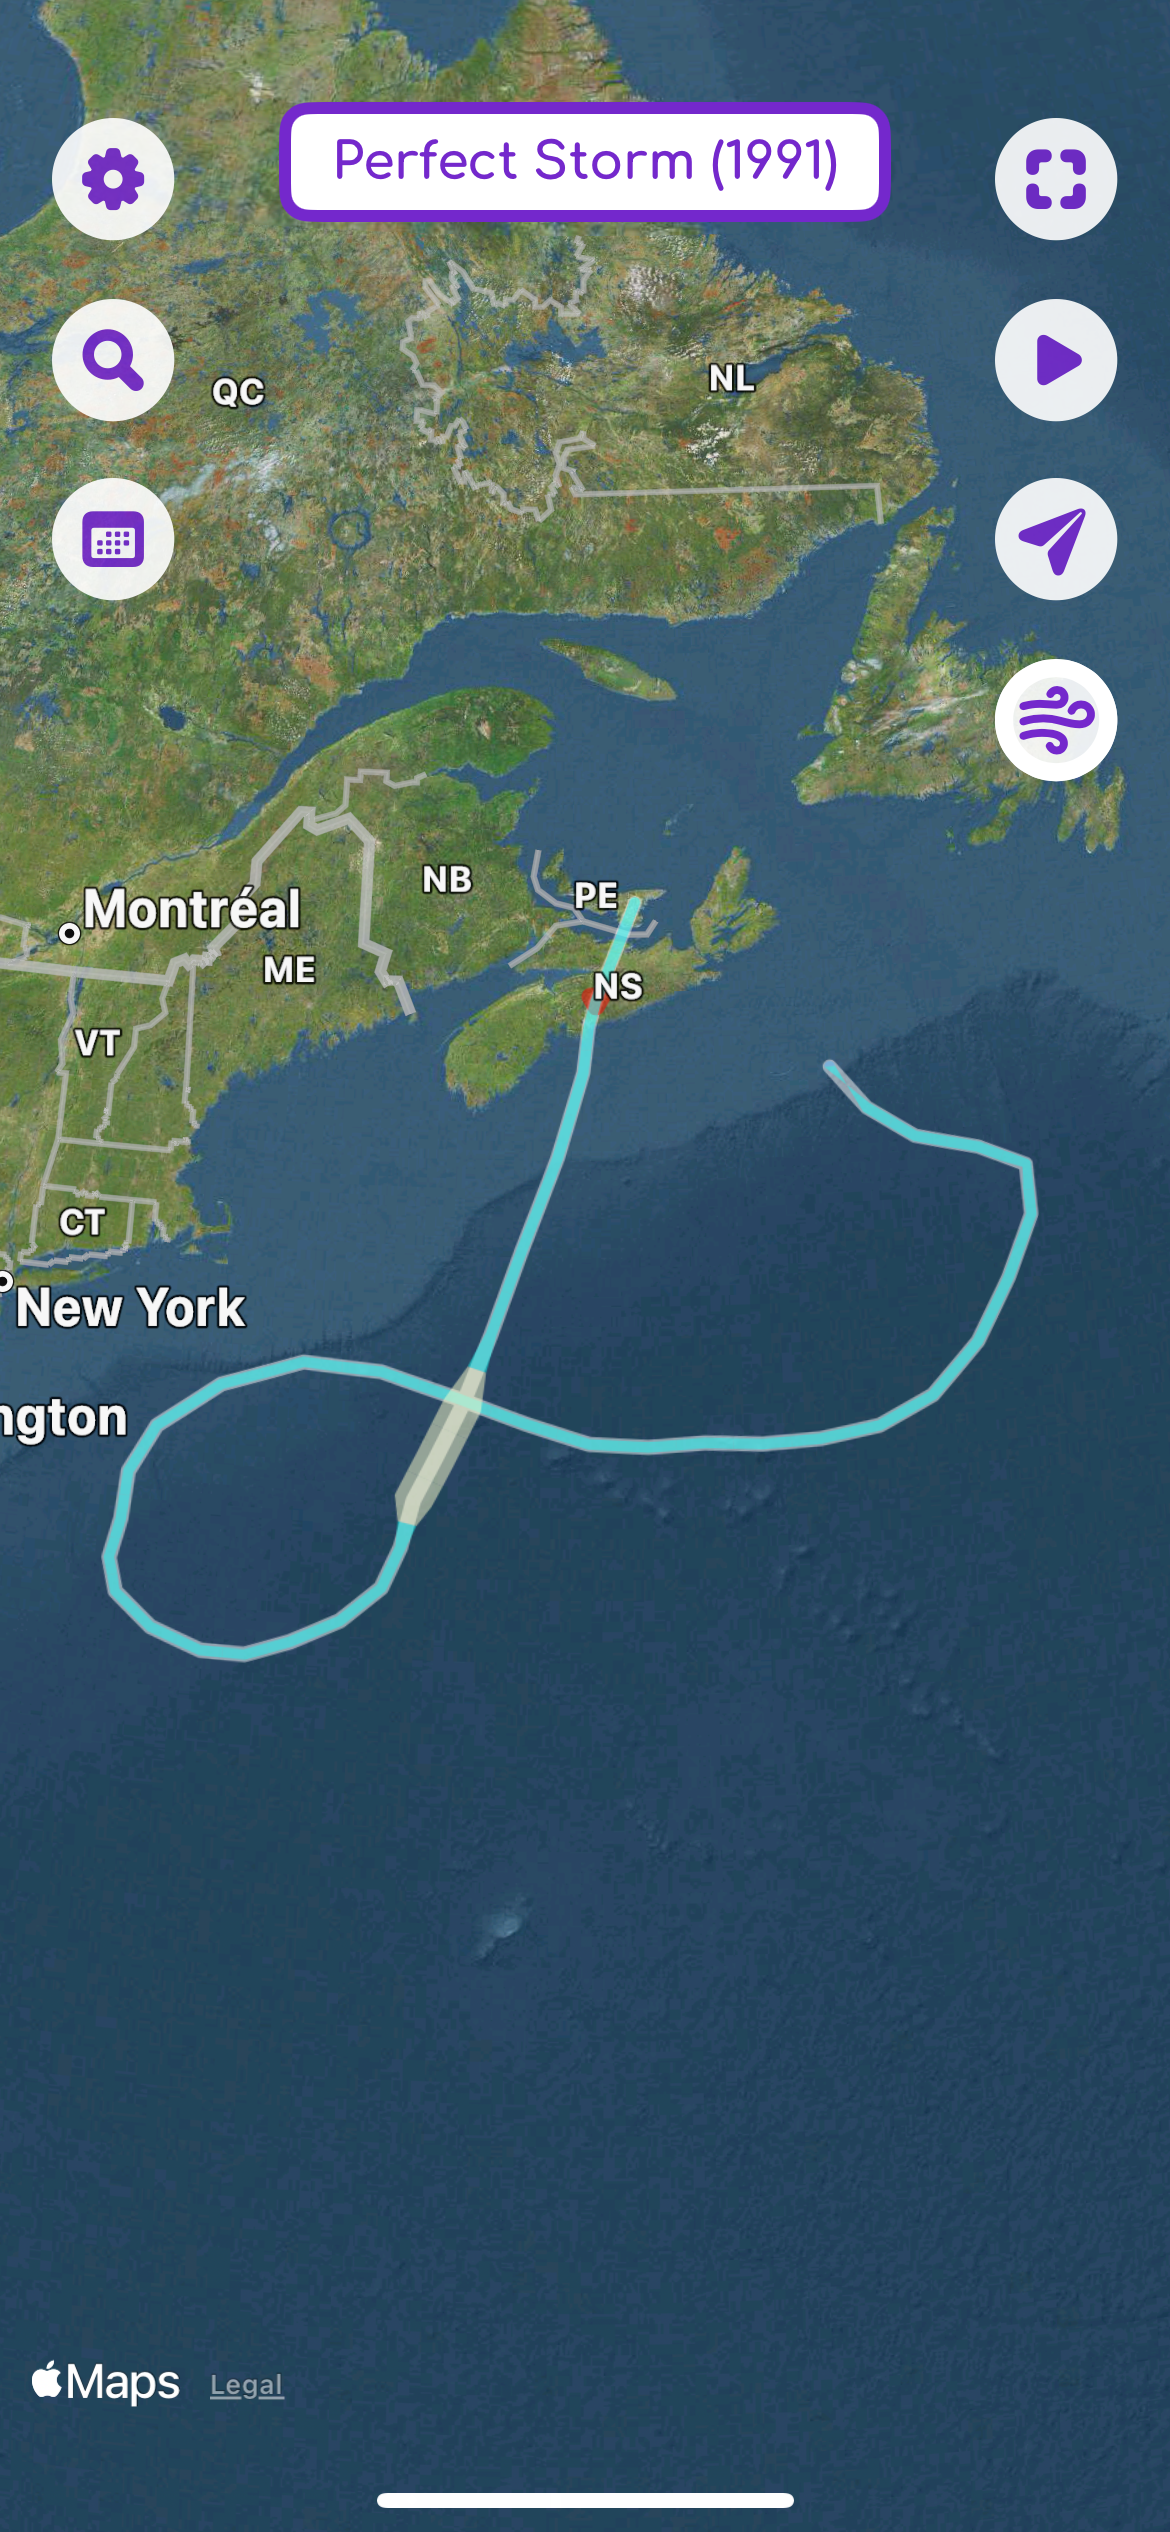
- Full history of storms going back to 1980
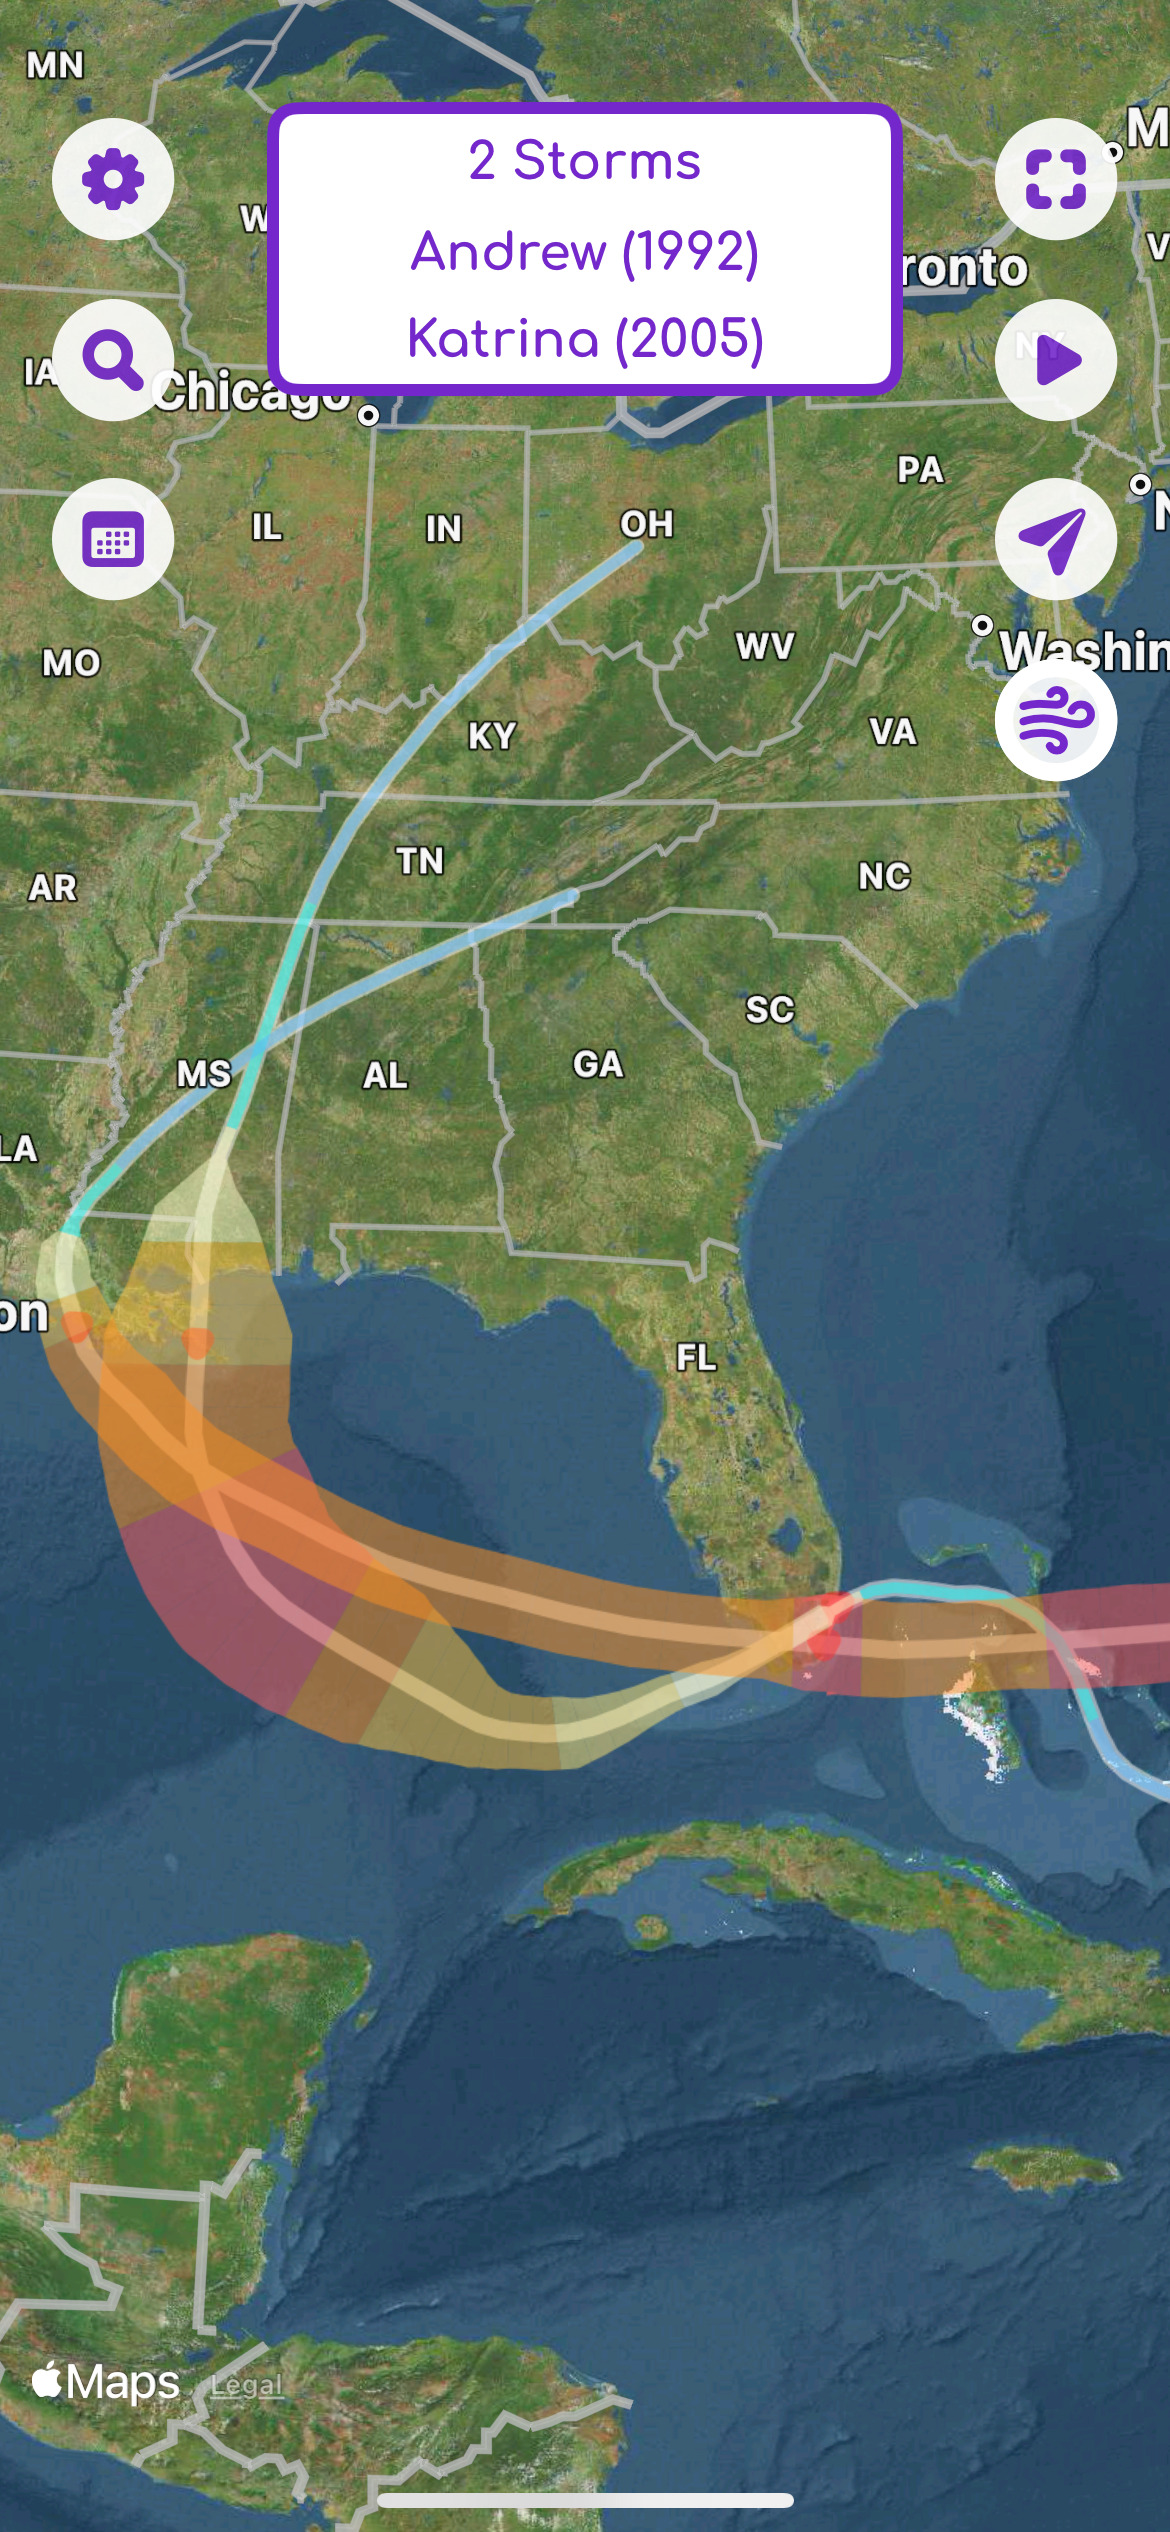
- Compare 2 or more hurricanes side-by-side on the map
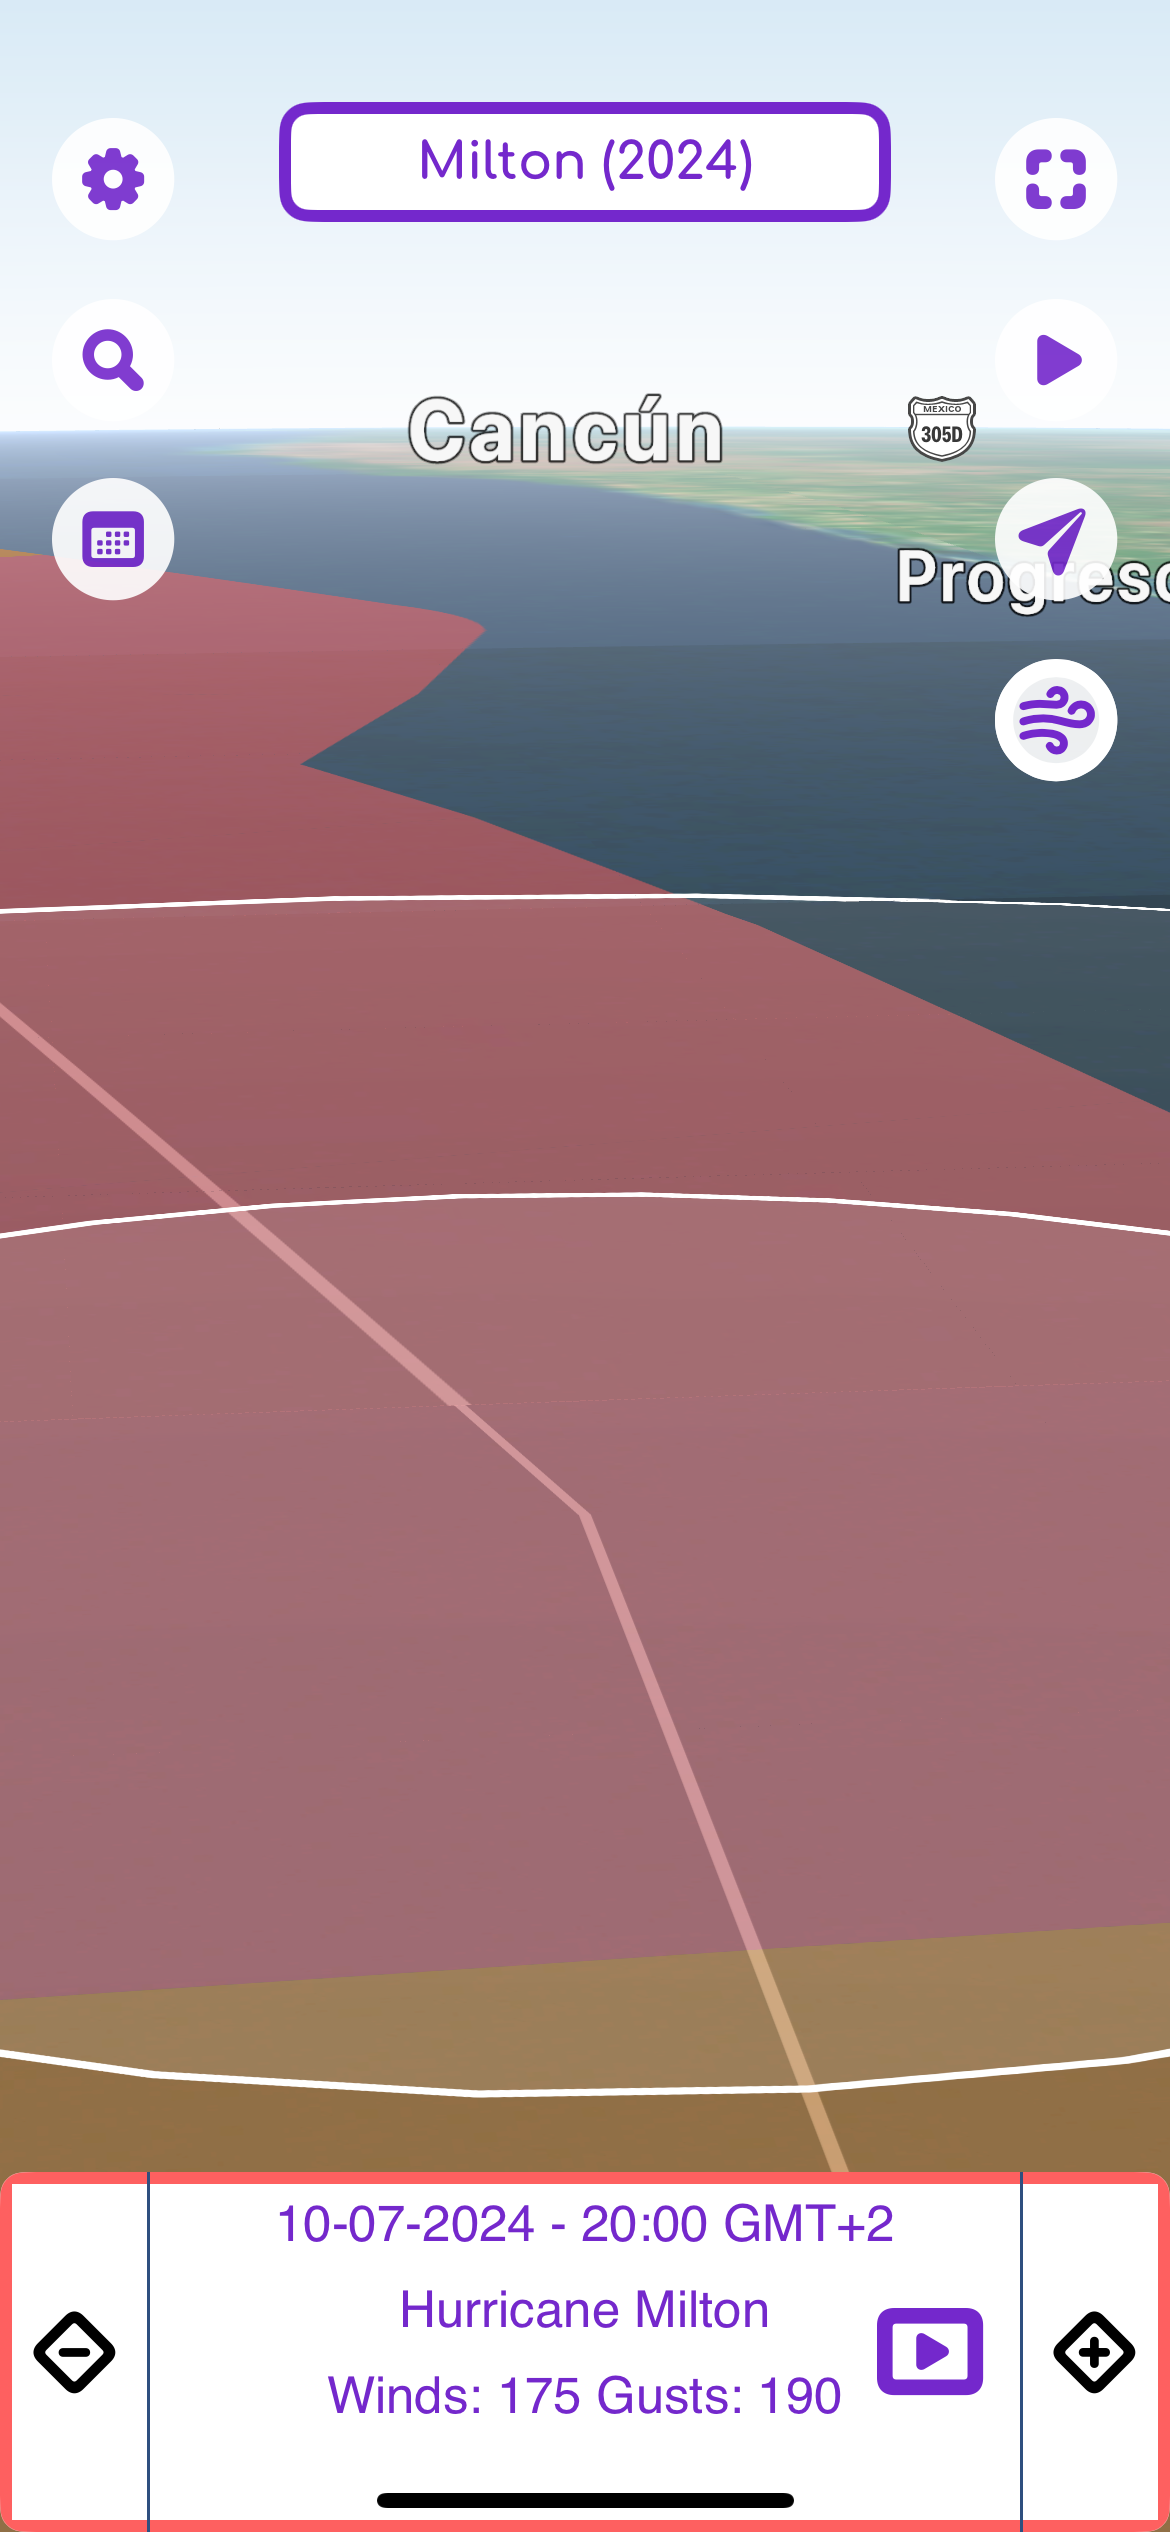
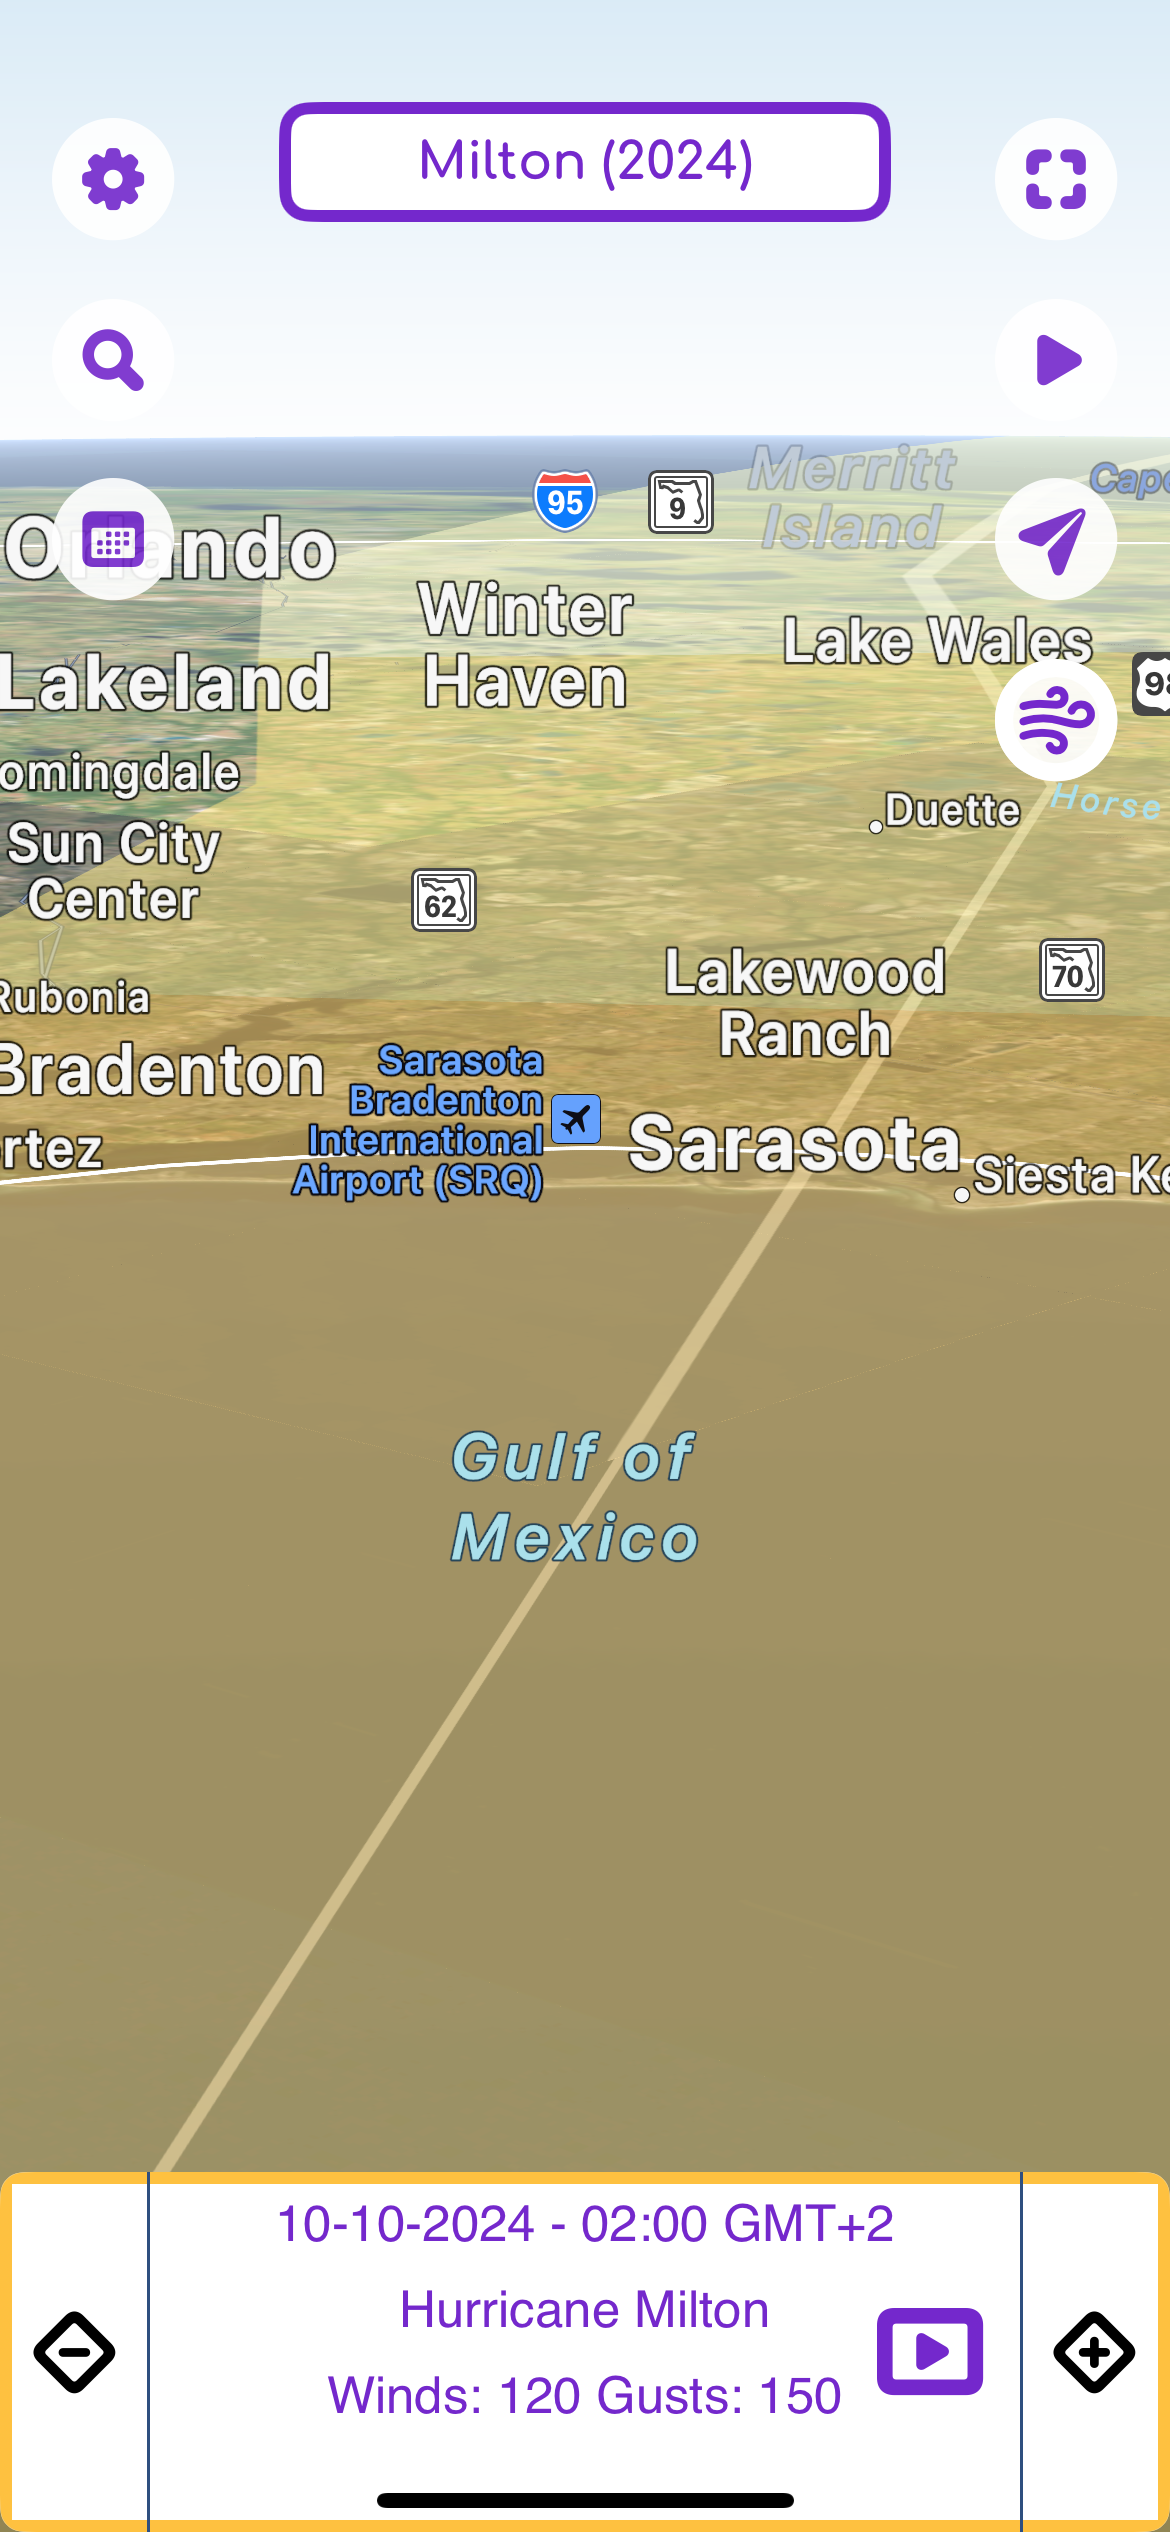
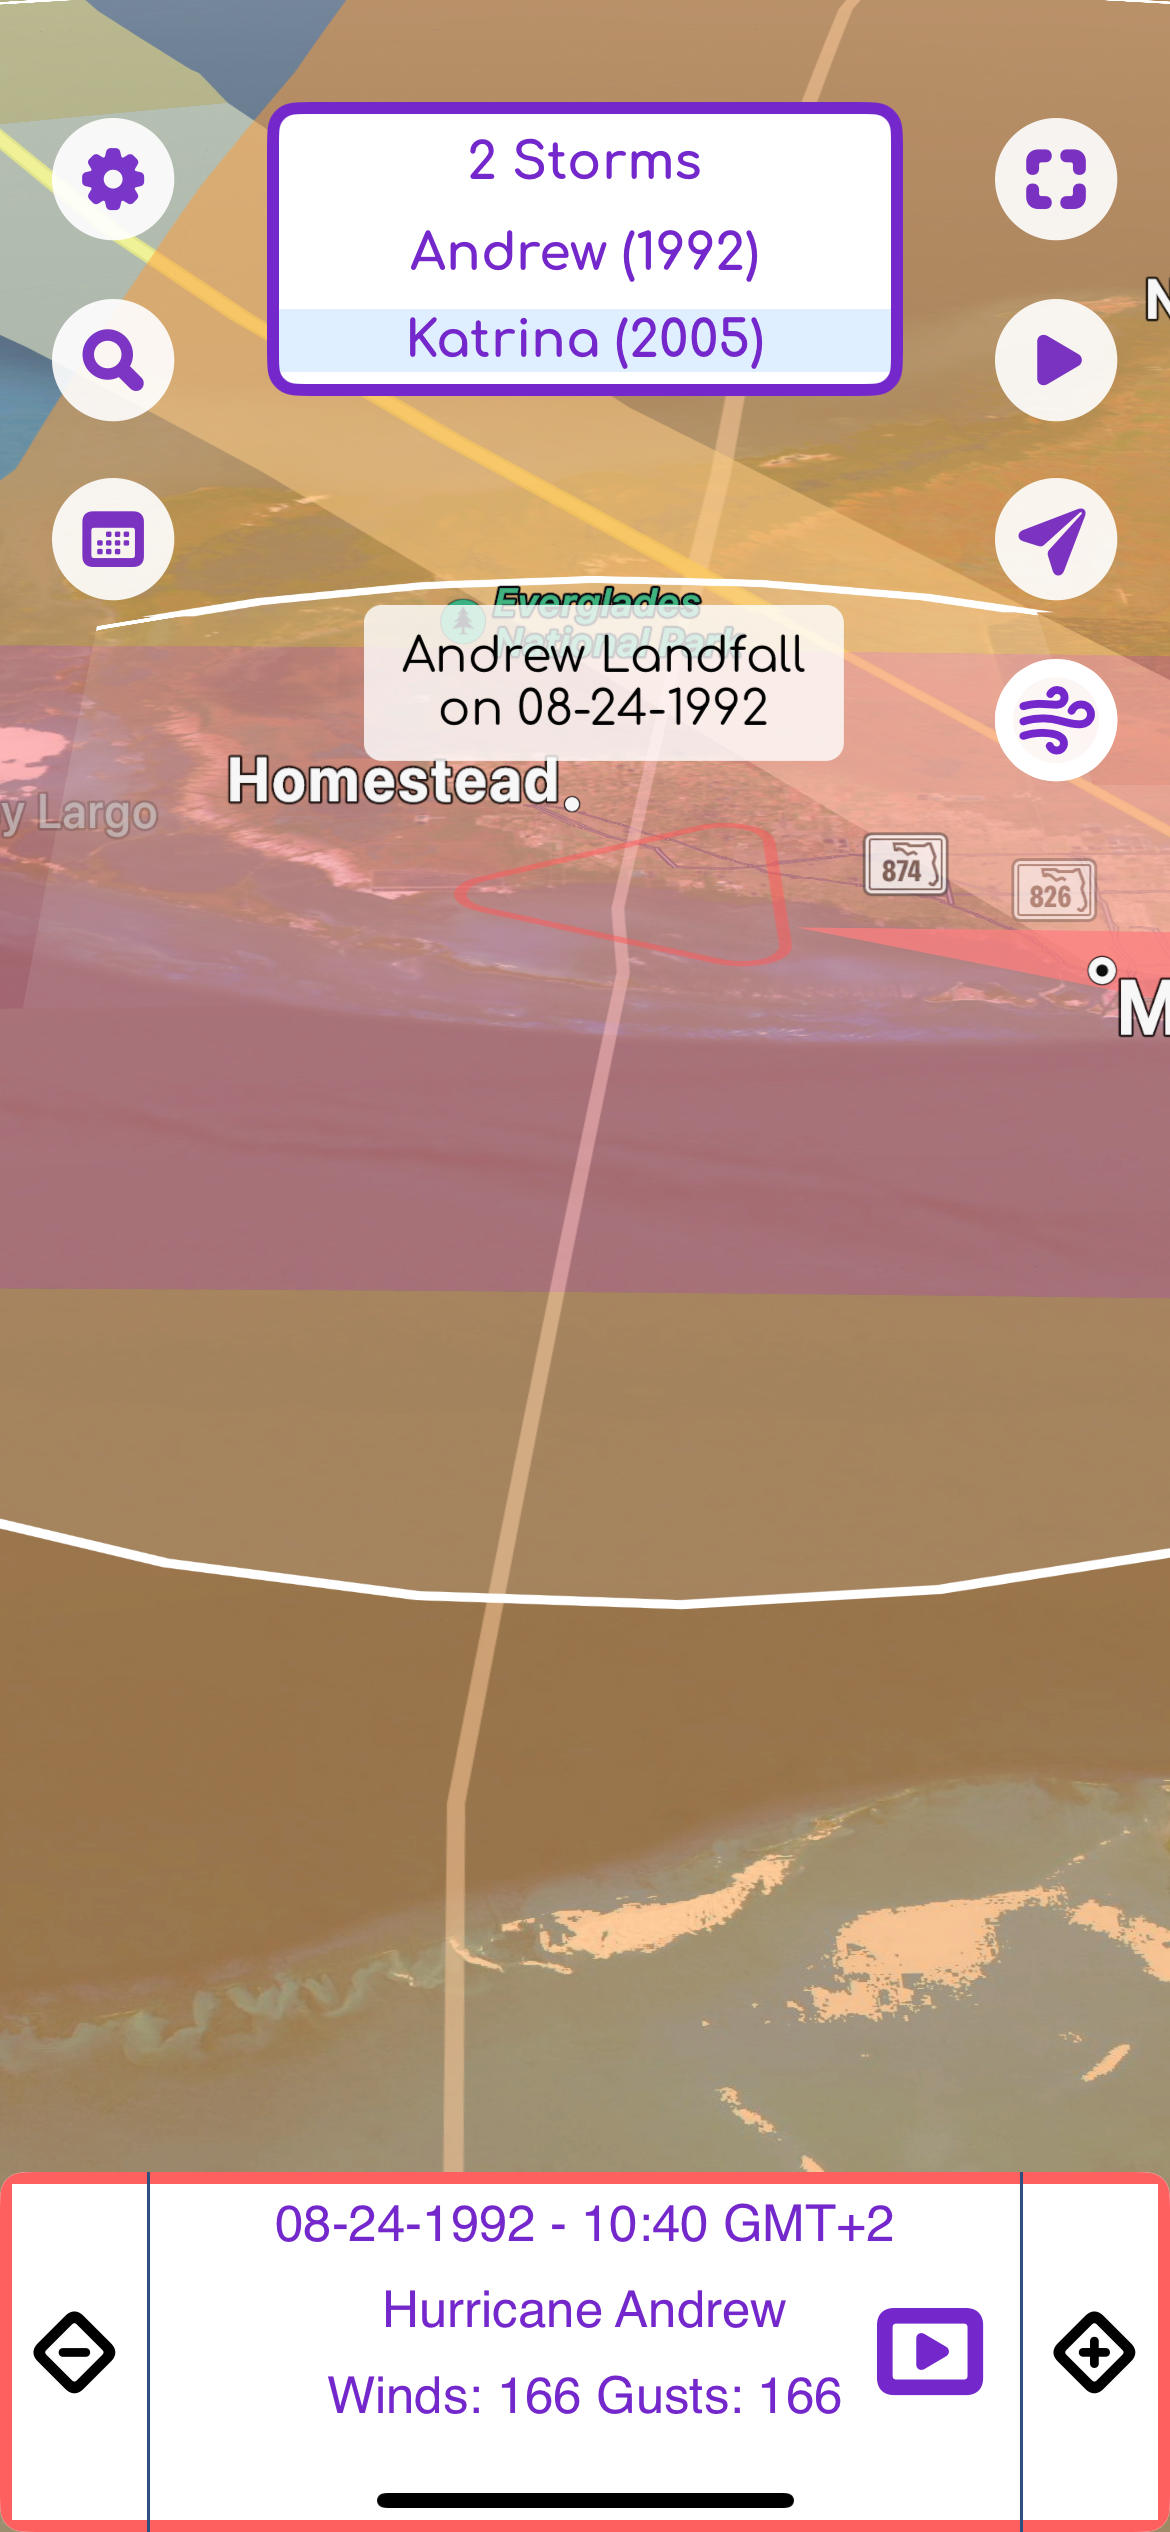
- Animate the path of hurrincanes
- Fly through the path of any hurricane